All brands want to tell relevant, engaging stories — through digital display ads, emails, social media ads, and more — that create seamless customer experiences and quickly grow revenue. However, the complicated nature of advertising and marketing online can get in the way of that, especially considering it takes 56 touchpoints for someone to convert. The reason for this is disconnected data.
If you’re using multiple marketing platforms to advertise online, ensuring that all this data is working together can be almost impossible. The disconnect creates a partial view of your customers — making it unnecessarily difficult to understand who they truly are, what they want, and what marketing initiatives are moving the needle.
This disjointed picture leads to a lack of personalization in customer experiences, meaning that audiences often see the same ads over and over again — creating lackluster experiences and ineffective marketing campaigns. If brands want to develop and implement tailored customer journeys, they’re forced to sift through data from multiple sources. As a result, this process becomes massively time-consuming. Brands are stuck having to try and tie this all data together on their own. This is a HUGE problem for all brands — small and large alike.
There’s a massive opportunity in the space to make analyzing advertising performance easier with a visual reporting dashboard that helps you hone in and measure performance trends across your marketing mix. Bringing all your channels into a single view can seem daunting, but there are a ton of user-friendly tools out there to help connect all your channels and build eye-catching dashboards. Let’s dive into some of the basics of performance reporting dashboards.
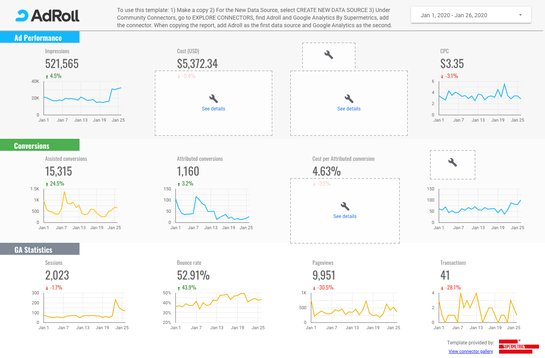
We’ve teamed up with Supermetrics to bring you a Google Data Studio template that allows you to see AdRoll campaign performance alongside your Google Analytics traffic data. Click on the image below.
What are Multichannel Reporting Dashboards?
Multichannel reporting dashboards are marketing tools that give businesses overviews of their digital initiatives and the specific goals they're tied to. This means identifying key performance indicators (KPIs) for individual marketing campaigns, measuring their effectiveness through customer journey analytics, and tracking their monetary impact on the bottom line. There are some basic, but significant benefits that come with utilizing a reporting dashboard:
Brands gain complete visibility of their businesses. Marketers can learn the results of their latest email blast and, with a few clicks, find out how much site traffic their latest brand awareness campaign has driven.
It's easier to spot hidden opportunities. With an eagle-eye view, marketers can uncover trends, test various facets of their marketing efforts, and make informed optimization with the help of incoming campaign and website data.
Save money and time. A multichannel reporting dashboard can help brands learn which are their most profitable channels (e.g., social vs. email vs. websites), where they should allocate their marketing spend to, and the ad types that drive the most clicks. This leads to less wasted time digging through multiple platforms, and less wasted advertising spend on channels that don't perform well for your business.
How Supermetrics and AdRoll Improves Marketing Efforts
Brands have to compare their paid marketing campaigns against each other and find ways to tie these efforts to their website data. By doing this, brands are able to evaluate their ability to drive website traffic and conversions. Supermetrics and AdRoll make it very convenient to build comparison reports by pulling all campaign data — from all active marketing channels — into a single report.
This not only makes it easier to understand campaign and channel performance but also share these digestible reports with other stakeholders and contributors. When it comes to reporting, this helps marketers to:
Automate your reporting. When working through multiple complicated steps, it can be easy to make a mistake. With the help of AdRoll and Supermetrics, brands can bypass granular data sourcing and pooling and go straight to creating custom reports.
Compare performance across channels. It's tough enough launching digital marketing campaigns without having to dig through multiple platforms to get a complete picture of your marketing. Understand how different channels drive audiences and interact with your website.
Furthermore, with AdRoll and Supermetrics, marketers are able to quantify website analytics and take informed action — making it easier to understand the story that their data is telling. By layering Google Analytics data on top of your AdRoll tracking, brands can get the following insights:
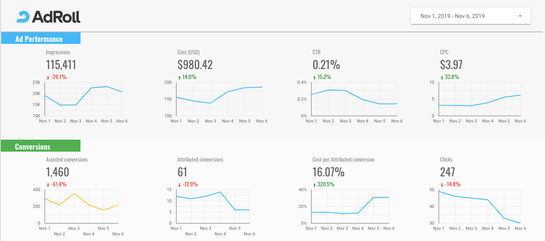
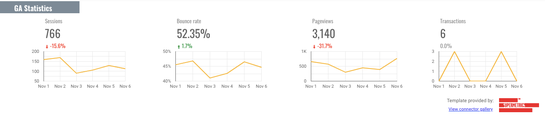
High-Level Overview Campaign Performance: This includes AdRoll metrics, such as impressions, cost, click-through rate (CTR), costs per click (CPC), and Google Analytics metrics, such as sessions, bounce rate, page views, and transactions.
AdRoll Dashboard
Google Analytics Dashboard
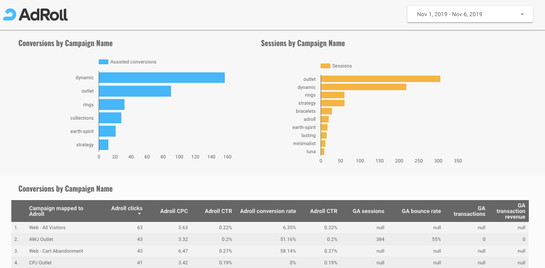
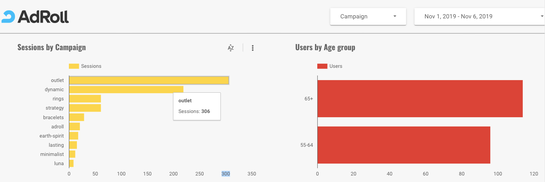
Sessions vs. Campaigns: Find out which campaigns are generating the most engagement on websites.
Demographics: Get a deeper understanding of all of the audiences that are engaging with your campaigns and website.
Are you interested in uncovering great insights, creating eye-catching (and easy-to-read) data reports, and making informed optimizations? We’ve teamed up with Supermetrics to bring you a Google Data Studio template that allows you to see AdRoll campaign performance alongside your Google Analytics traffic data.