One of the most critical metrics that online retailers should measure, but often don't, is the cart abandonment rate. This number helps to determine how many potential consumers leave without purchasing anything. After all, high rates of cart abandonment signal a deeper problem that needs to be addressed, including poor user experience, slow page load times, high shipping costs, lack of coupons, limited payment options, and more.
While the exact cause may not be immediately apparent, monitoring the metric enables brands to know when it's essential to make a more in-depth assessment. Addressing site issues on time can prevent cart abandonment from happening continuously, improve sales, and allow brands to recover from losses more quickly.
How To Calculate Cart Abandonment Rates
There’s good news: You don't have to perform complex mathematical equations to calculate this metric. Cart abandonment rate is simply the percentage of shopping carts that didn't convert — the easiest way to determine your cart abandonment rate is first to calculate your cart conversion rate, which is just the number of completed purchases divided by the number of shopping carts opened.
Let's say your business recorded 100 completed purchases within the month, and 800 shopping carts opened, which equates to 12.5% completed transactions.
Then, the cart abandonment rate is simply 1 - the cart conversion rate: 1 - 12.5% = 87.5%.
How to Track Cart Abandonment Rates in Google Analytics
If you've set up ecommerce tracking in Google Analytics, you don't have to do the math yourself. Google Analytics automatically tracks and calculates the conversion and abandonment rates for you. Just navigate to Conversion -> Ecommerce -> Shopping Behavior, and you'll find the numbers you need.
Shopping Behavior Report
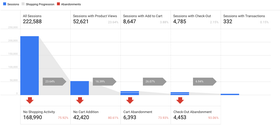
In the Shopping Behavior report, you'll see a funnel report that tracks five main activities:
Visits to Your Site
View Product
Add to Cart
Begin Check-Out
Complete Transaction
Source: Google Analytics Demo Account
The numbers at the top of each column represent each activity's count, and the numbers at the bottom of each column represent the drop-off from each step. In the example above, there are 8,647 carts opened and 6,393 of them (or about 74%) abandoned. But what about those who moved to checkout but didn't complete the purchase?
Cart abandonment vs. check-out abandonment
In Google Analytics' Shopping Behavior Report, the checkout abandonment number represents the number of shoppers who started checking out but didn't complete the purchase. Checkout abandonment is essentially a subset of cart abandonment.
Cart abandonment refers to shoppers who have added a product to the shopping carting cart but didn't complete the purchase. These people may not have started the checkout process and could remain anonymous to you.
Checkout abandonment refers to shoppers who have started the checkout process but left without completing the purchase.
As the Shopping Behavior Report separates "Add to Cart" and "Checkout" into two different steps, it helps marketers discover where the purchase process's leakage occurred. However, the cart abandonment rate shown in the Add to Cart column only accounts for the drop-off from Add to Cart to Checkout, but not all the way from Cart to Purchase. Fortunately, it'd only take one simple calculation to determine the true cart abandonment rate based on our definition.
Get the cart abandonment rate from the Shopping Behavior Report
To get the abandonment rate from Add to Cart all the way to Purchase from the Shopping Behavior Report, we can use a modified version of the formula.
Using the sample data above, the cart conversion rate = 26.07% * 6.94% = 1.81%
Cart abandonment rate = 1 - 1.81% = 98.19%
Analyze the purchase funnel by segments
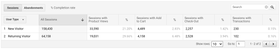
Another powerful feature of the Shopping Behavior Report is that it allows you to break down the purchase funnel by segments. Right below the funnel chart, you'd see a table like this.
Source: Google Analytics Demo Account
By default, it breaks down the data by user type. However, you can choose to break down the data by geographic locations, device types, campaign medium/source, etc. This allows you to compare shopping behavior among different segments of your shoppers.
Cart Abandonment = Opportunity
The cart abandonment rate is an essential metric for online retailers, as it often indicates the reliability and appeal of the shopping experience. Using the methods in this guide, you can easily measure your cart abandonment rate with Google Analytics and identify areas for improvement. By addressing your purchasing flow issues and improving the customer experience, you can turn lost sales into fresh opportunities — especially when you have a powerful marketing tool like AdRoll to help.