Ever experienced a burst of dopamine after receiving a new follower, like, or share? Although these numbers can feel like an affirmation that you’re acing your social media strategy, the truth is they’re a mediocre indicator of performance. (For example, while gaining a thousand new followers may seem impressive, it becomes significantly less impactful when you realize they’re all bots.) In fact, the number one mistake that many marketing amateurs make is focusing on chasing after these vanity social media metrics.
Social media metrics have long been a tricky thing to master — the numbers fluctuate, you’re not sure what to look at, and it can be unclear what to do next. The challenge only mounts when you realize your social media efforts cover thousands of interactions across platforms. Add in the cost of advertising on social media, and it’s enough to drive anyone batty.
Whether you’re just getting started with social media marketing or are a seasoned professional, it’s crucial that you dig behind the data, find the bigger story, and make key decisions based on genuine insights.
That’s why we’re here to help you out — though we can’t offer magical KPIs that you should strive for, we can point you in the right direction in terms of social media metrics that deserve your attention. With that, you’ll be one step closer to attracting new audiences, engaging existing customers, and reaching your ecommerce goals.
1. Audience Growth Rate
Rather than count the number of followers you have, we recommend tracking the rate at which your followership is growing. (Even better, track the audience growth rate for your competitors as well.) It’ll give you insight into the impact of specific campaigns and tactics over time.
How to calculate it:
Choose a reporting period.
Count the number of your net new followers during that period.
Divide your net new followers by the number of your total audience.
Multiply the number by 100 for your audience growth rate percentage.
How to boost it: Rather than treating each of your marketing channels as separate silos, don’t be afraid to cross-promote. For instance, send an email to customers encouraging them to follow you on social media if they haven’t already (for access to exclusive content or a similar offer).
2. Average Engagement Rate
The best marketers treat social media as a two-way communication channel rather than a one-way broadcast. With that said, calculating your average engagement rate can provide you with a glimpse into whether your content truly resonates with your audience. When someone interacts with your account, they’re acknowledging it’s caught their eye and deserves their time to respond.
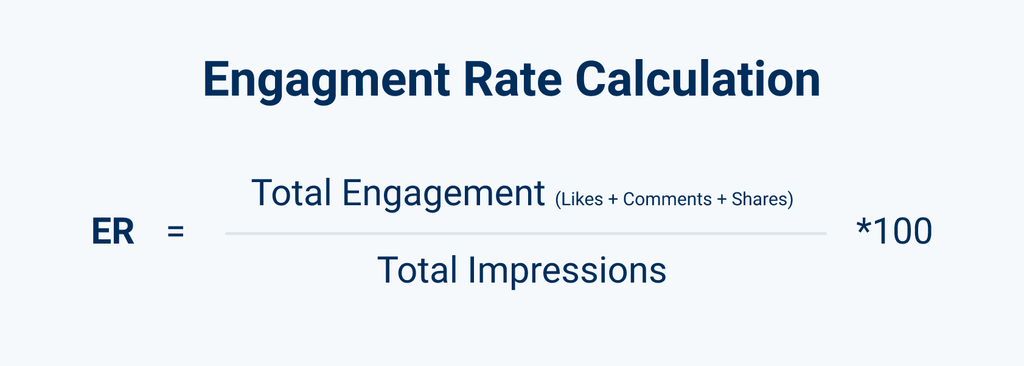
How to calculate your average engagement rate.
When measuring average engagement rates, you’ll realize the specific number of likes, shares, and comments you receive don’t actually matter — getting 30 comments on a post is a lot more meaningful when you only have 150 followers.
How to calculate it:
For every post, add up the total number of likes, shares, and comments.
Divide it by your total followers.
Multiply that by 100 for your average engagement rate.
How to boost it: Ask questions, use polls, post a challenge — anything that encourages responses can go a long way in increasing engagement rates.
Pro Tip: If you’re seeing low numbers, don’t freak out! The ideal average engagement rate differs between platforms — you’ll usually see numbers that hover around 0.2-1% for Facebook and Twitter, but this number rises significantly for Instagram at 3-6%.
3. Post Reach
Not sure if people see your content? Post reach can be a good metric to analyze the effectiveness of your posting strategy, including the date and time.
How to calculate it:
Find the reach of your post (usually provided by the platform).
Divide the number by your total number of followers.
Multiply it by 100 for your post reach percentage.
How to boost it: A/B test your post frequency, date, and time to determine your ideal strategy. Remember: There is no magic formula — it’ll depend on your audience’s habits and preferences!
If you’re using paid social media ads, a similar metric to pay attention to is your cost per mille (CPM). CPM is the amount you pay per one thousand visitors who see your ads.
4. Conversion Rate
The goal of social media marketing is to drive more conversions, whether that’s completing a purchase, subscribing to emails, or joining a loyalty program. No matter what your CTA is, your conversion rate is a critical number that’ll reveal how effective your posts are at driving these actions. A high conversion rate means that your content is compelling enough that people are willing to learn more.
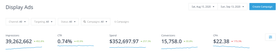
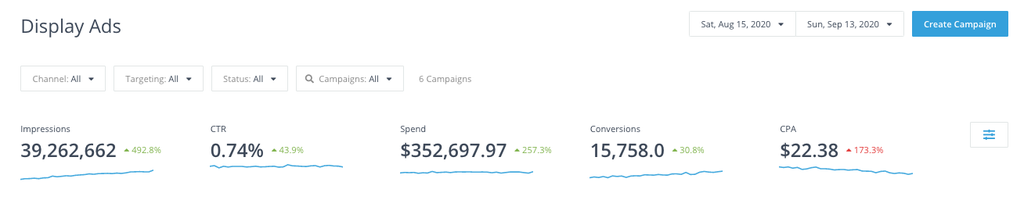
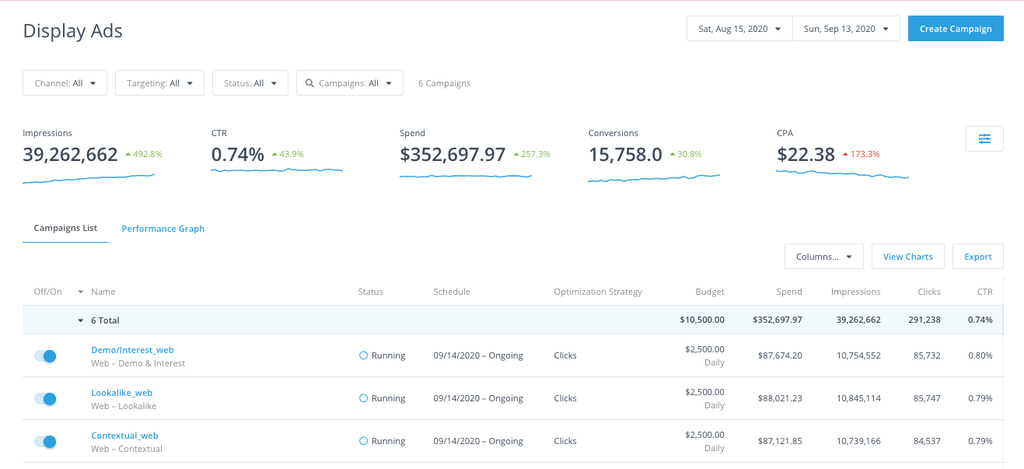
With a tool like AdRoll, you don’t need to panic about doing math! Instead, we’ll show you your impressions, click-through rates, conversions, and more social media metrics.
How to calculate it: No calculations are needed here! Head over to your ecommerce analytics platform to check the total number of clicks and conversions driven by specific social media posts.
How to boost it: If people are clicking but not converting, there might be a disconnect between your post and your landing page. Check that your messaging, visuals, and offers are consistent, so shoppers have a seamless experience.
5. Cost-Per-Click
Running social media ads? Cost-per-click (CPC) is the metric for you, especially if you’re struggling to keep your budget under control. As its name implies, cost-per-click is the spend for each click on your social media ads, whether on Facebook, Twitter, or LinkedIn. It’ll help you determine if your investment in a specific platform, ad type, or ad creative is a great use or massive waste of your budget.
Even more determined social media advertising pros can target their Return on Ad Spend (ROAS), another metric that closely relates to CPC. Targeting ROAS is becoming an increasingly popular way to budget and bid on social media advertising. If you’re new to this concept, a ROAS calculator can help.
How to calculate it: No calculations are needed! It’ll be provided in your ad analytics platform.
How to boost it: Lowering your cost-per-click will involve A/B testing all the different elements of your ads, including platform type, ad type, messaging, imagery, CTA, and more.
6. Click-Through Rate
Your Click-through rate (CTR) is how often someone clicks on the CTA in your social media ads. It’s a great tool when you’re A/B testing the various elements that your ad comprises — have more people clicked on an ad with a “Learn More” versus a “Shop Now” button? Or maybe the ad using a lifestyle photo received more clicks than the one with a product photo?
How to calculate it:
Count the total of clicks on a social media ad.
Count the total impressions on that same ad.
Divide the total clicks by the total impressions.
Multiply the number by 100 for your click-through rate percentage.
How to boost it: Similar to cost-per-click, you’ll want to experiment with all the different parts of your ad to see their impact on the click-through rate.
Get Measuring! 📏
With these six social media metrics, you’re well on your way to better organic and paid social media marketing. But we’ve got one last tip for you: While each social media platform will provide its unique analytics, you’ll want to leverage an all-in-one dashboard tool like AdRoll's social media ads platform to see how everything works together. The more data you have access to, the better decisions you can make!
Most online shoppers will experience multiple social media touchpoints before converting, so you’ll want to see precisely how each platform drives results before attributing credit. This will also give you a better idea of where you can improve.
For more data and analytics tips, don’t forget to visit the AdRoll Marketing Resource Library. Don’t wait — start tracking, measuring, and analyzing now!
Social Media Metric FAQs
Whether you’re new to digital marketing metrics or need help understanding which KPIs make the most sense for your brand’s campaigns, you probably have questions. Listed below are some common concerns people have when discussing KPIs.
What are the most common social media advertising metrics and how are they measured?
There are several different metrics that you can use to measure social media advertising effectiveness. They include, but aren’t limited to:
Impressions: How many times your ad is served on a platform
CTR: The percentage of people who click on your ad after seeing it.
CPC: The average cost of each click on your ad.
Conversion rate: The percentage of people who take desired action, like making a purchase, after clicking the ad.
CPA: How much it costs to acquire a new customer through your ads.
ROI: How much revenue you earned compared with how much you’ve spent on advertising.
How do I determine which social media advertising metrics are most important for my business goals?
Tracking social media metrics is essential for anyone who uses it for marketing, but there are several options to choose from. How do you know which ones are right for you?
The best metrics to focus on are the ones that measure what you want to achieve with your campaigns. If your goal is raising brand awareness, then impressions and reach are more relevant. Sales-driven advertisers might look at conversions and ROI instead.
Identify each campaign’s specific objectives and align metrics accordingly, but don’t just shoot for the moon. Establish benchmarks that help track your progress over time.
How do you track ROI of social media advertising campaigns?
Tracking ROI is a multi-step process, but it’s an essential one. Compare the revenue your campaigns generated with the costs of running them. The basic steps include:
Set up conversion tracking on your website to track the actions customers take after they click your ad.
Assign values to each conversion based on how much money it generates. If sales generate $100 in revenue, assign that value.
Calculate all social media advertising costs, including ad spend, creative costs, and any management fees.
Once you know the total revenue your social media campaigns generate and the costs of running them, subtract the cost from the revenue, divide by the cost, and multiply by 100 to get the percentage ROI.


